A graphic often has the power to communicate in ways lists cannot. Create a chart from a list of records to display the results of your research as a graphic.
This document addresses the following topics.
To create a chart,
Perform a search to create a Result Set, or open a Work File
Select Analyze from the toolbar, then Charts.
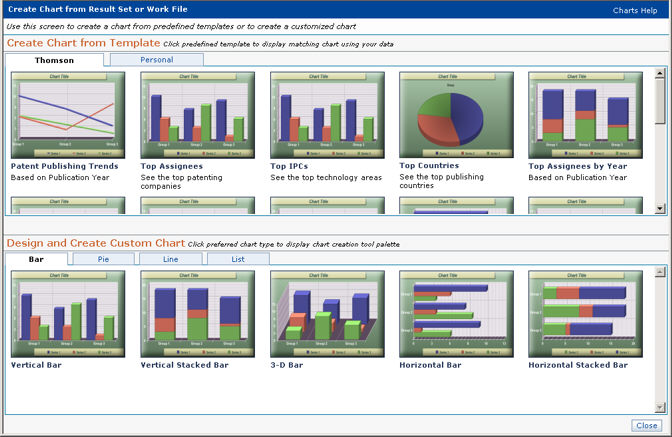
The Charts screen, shown below, displays.
Select an existing Thomson Innovation Chart template, or create a new Custom template.
A Chart template is a set of saved chart properties. Thomson Innovation provides a collection of standard templates, each one designed to illustrate a different aspect of your list of records.
Chart properties include
Title
Description
Content
Chart Type
Visual Options
Primary Field to Analyze
Secondary Field to Analyze
Tertiary Field to Analyze
2D or 3D
Number of Items for Primary Field
Number of Items for Secondary Field
Number of Items for Tertiary Field
Thomson Innovation includes pre-configured 14 Chart templates. Choose any of these to create your chart.
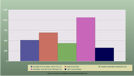
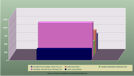
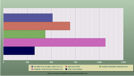
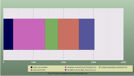
Click on any of the 14 Thomson Innovation template images below to see an enlarged image.
|
|
|
|
|
|
|
|
|
|
|
|
|
|
|
|
|
|
Click on one of the available Thomson Innovation Chart templates from the Existing Template area to select it and create a chart.
To edit a chart
Select any Chart template or open any saved Chart
Click Edit on the Chart toolbar. The Chart Properties panel, shown below, displays
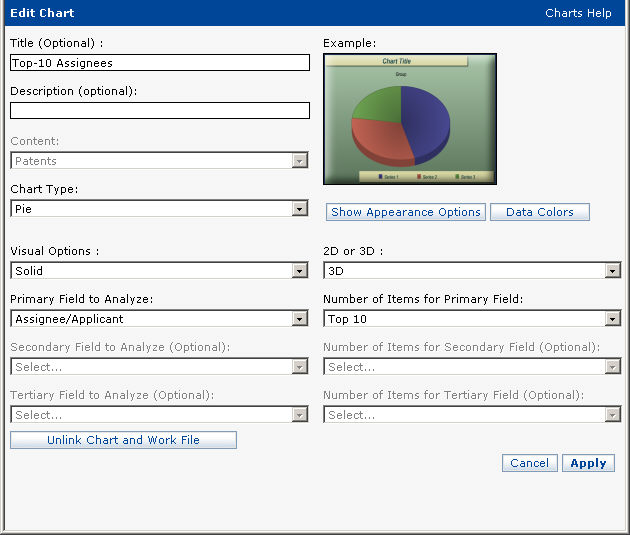
Edit the chart properties
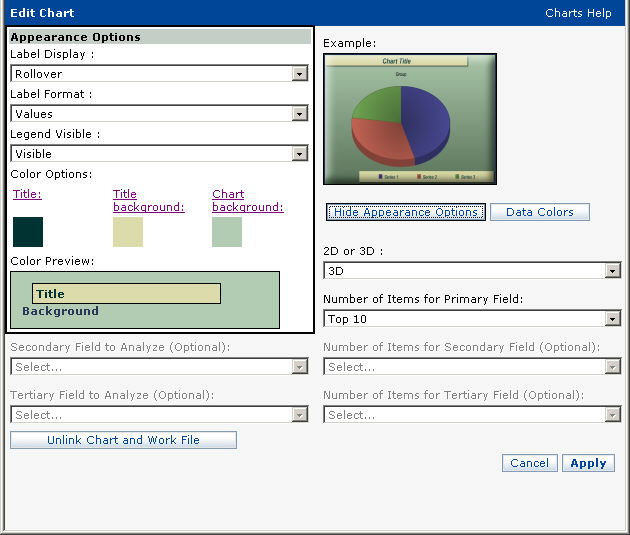
Press Show Appearance Options to expose the Appearance Options panel, shown below. Press Hide Appearance Options to close the Appearance Options panel.
Press Data Colors to change the color associated with each chart entity. The Data Color Options panel is shown below.
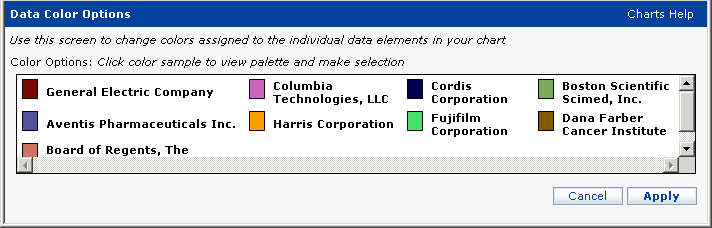
6. Click on a color square to display the Change Color panel, shown below. Click on a color to select it, then press Apply.

7. When you have finished editing colors, press Apply on the Change Color panel.
8. When you have finished editing chart properties, press APPLY on the Chart Properties panel.
Choose one of four Save options to save your chart.
Press Save on the Chart toolbar.
Save Chart
SAVE CHART saves your chart in the default folder in the Saved Work area. Links to the list used to create your chart are retained.
Template
SAVE TEMPLATE saves your chart as a template in the Personal area of the Charts screen. Links to the list used to create your chart are not retained.
Data as Work File
Create a new Work File containing the list items used to create your chart.
Image (JPEG)
Create a bitmap image of your chart in the JPEG format and save it to your local hard drive.
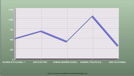
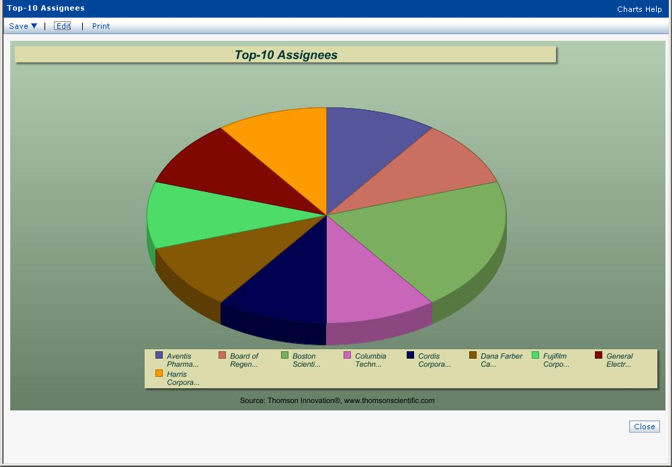
A typical chart is shown below.
Generate a result set or open a work file.
Press Charts on the toolbar.
Select a chart type from the Design and Create Custom Chart panel. Click on any of the 8 Thomson Innovation template images below to see an enlarged image.
Click on one of the available Thomson Innovation Chart templates from the Design and Create Custom Chart area to select it and create a chart.
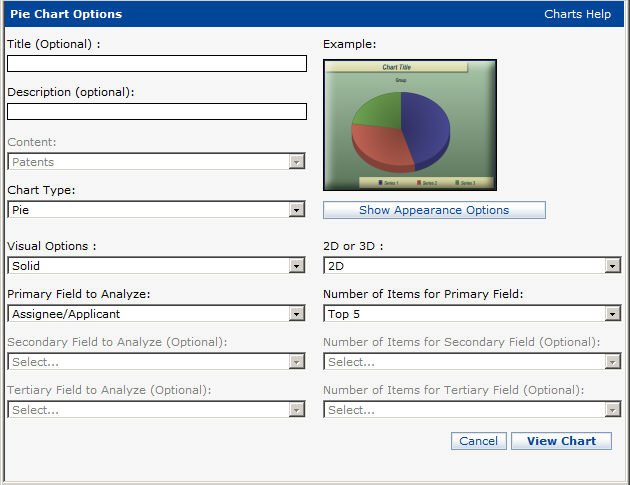
Configure the chart options on the Chart Options panel, shown below. Available options vary depending on the content type you use to create your chart.
Press the View Chart button  .
.
Optionally, press edit on the chart toolbar to further edit chart options.
Press Save on the chart toolbar and select a save option. See Save a Chart, above, for details.