A Citation Map is a graphical representation that shows the citation relationships (cited references and citing articles) between a paper and other papers using various visualization tools and techniques.
Using citation mapping, you can analyze which researchers are citing your papers. You can also choose to organize and color code the results by author, year, journal title, subject category, and more.
You can also set up a graphical representation of the papers that you have cited in a published work. You can then choose to organize and color code the results by author, year, journal title, subject category, and more.
From a Full Record page, click the Citation Map link to go to the Citation Map start page where you can begin to create your Citation Map.
Forward Only: View records that cite the selected target (focus) record whose name appears in the title bar at the top of the page.
Backward Only: View records that the target record cites.
Forward and Backward: View both forward and backward records.
First Generation - Records that cite or are cited by the target record are first generation. The default generation is set at 1.
Second Generation - Records citing records that cite the target record and records cited by records cited by the targeted record are second generation.
3. Click the Create Button to Create Your Citation Map
After you create your Citation Map, the target record is shown in the middle of the Citation Map panel.
To the right of the target record are papers that cite the original paper (citing articles). This is the forward view.
To the left of the target record are papers that are cited by the target record (cited references). This is the backward view.
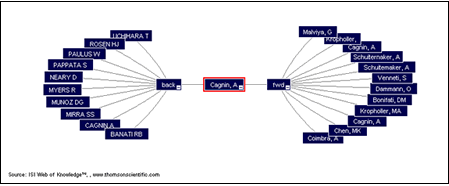
The Citation Map is generated and displayed in a three-panel window.
-
The top panel (Citation Map) is an interactive graphical presentation of the Citation Map consisting of a citation tree of nodes (records) showing their citation relationships.
-
The lower left panel (Results Set) displays a summary of cited and citing records in the Citation Map along with the Primary Author, Journal Name, and Article Title.
-
The lower right panel (Record View) displays the Full Record of the target record.
- Above the Citation Map are menus and options that allow to manage and control of the appearance of the Citation Map.
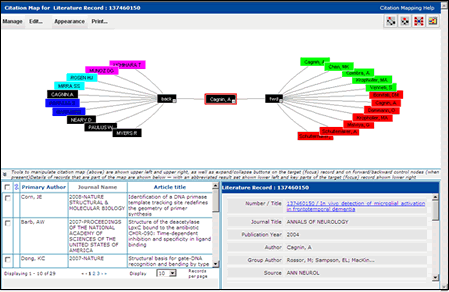
View of Citation Map, Results Set, and Record View Panels
You can move the nodes around (including the target node) by clicking and dragging them using your left mouse key. This feature allows you to see parts of the map that are on the edge of the panel. This dragging action also brings the centered-map section into view so you can see the individual nodes more clearly.
By hovering your cursor on any node, you can view bibliographic information about that paper.
A white expand / collapse button displays in the bottom-right corner of the target node if there are citations for that record. Click to expand or collapse the display. You can also find these buttons on the back and fwd nodes.
Results Set and Record View Panels
The lower portion of the Citation Map window contains a Results Set panel (lower left) and a Record View panel (lower right).
A close ![]() control icon above the Results Set panel allows you to close the Results Set and
Record View panels and view the Citation Map in full screen mode.
control icon above the Results Set panel allows you to close the Results Set and
Record View panels and view the Citation Map in full screen mode.
An open ![]() control icon allows you to reopen the Results Set and Record View panels and view
record data.
control icon allows you to reopen the Results Set and Record View panels and view
record data.
The Results Set panel contains all of the records covered by the Citation Map you are currently viewing.
-
The right
 arrow means the record is a citing article.
 - The left
 arrow means the record is a cited reference.
The check box for the target record is always selected when the Citation Map initially displays.
-
Click the Primary Author link to sort the list of records alphabetically by author name from A to Z or click again to sort the names from Z to A.
-
Click the Article Tile link to sort the list of records alphabetically by article title from A to Z or click again to sort the titles from Z to A.
Use the check box to select one or more nodes - a red border appears around each selected node in the Citation Map. Choose Set Node Color from the Appearance menu to change the color of each selected node in the Citation Map.
The Select All ![]() check box in the column header allows you to select all records in the panel.
check box in the column header allows you to select all records in the panel.
Use the standard page ![]() navigation arrows to move from page to page in the panel.
navigation arrows to move from page to page in the panel.
Use the standard Display ![]() menu to choose to display 10, 20, 50, or 100 records in the panel.
menu to choose to display 10, 20, 50, or 100 records in the panel.
The Record View panel displays field data for records in Web of Science. The Number / Title of a record is linked to the Full Record in Web of Science.
By selecting and double-clicking any node in the Citation Map, you can view Full Record details about that record in the Record View panel.
Note the following:
-
If no Author is available but a Group Author is available, then we provide the Group Author label.
-
If no Group Author is available but an Author is available, then we provide the Author label.
The Manage menu allows you to create a new Citation Map and to save a Citation Map as an editable image.
Create New Citation Map
This options allows you to create a new Citation Map for a selected node that appears on the citation tree and in the Results Set panel.
Select the check box next to the new target record. The node in the citation tree is highlighted.
Select Create New Citation Map from the Manage menu. This opens a new browser window and displays the Citation Map start page.
Select the direction and generation depth on the Citation Map start page.
Click Create to display the new Citation Map.
Save Citation Map As Image
This option allows you to save your Citation Map as an independent image. The default format for saving the image file is PNG (Portable Network Graphics).
After you select this option, you can open the image or save the image to a folder on your computer. During this process, you can change the file format to another format such as GIF or BMP by replacing the PNG file extension after the file name.
If you have a graphics tool (for example, Macromedia Fireworks), you can modify your graphics image. For example, you can add text, notes, or resize your image.
Before using this option, check to ensure that Pop-up Blocker is turned off with your browser.
The Edit option allows you to change the direction of your Citation Map and the number of generations that appear. When you select Edit, the Citation Map start page appears for the current target record.
The Appearance menu allows you to order, color-code, and label citation tree nodes according to various record fields.
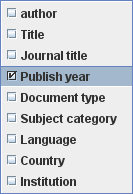
Order Nodes By
This option allows you to select a field by which to sort the nodes. Each node in a node grouping is sorted by the selected field alphabetically / numerically.
For example, by selecting Publish Year from the Order Nodes By menu, you can group records that were published in the same year.
Order Nodes By Menu
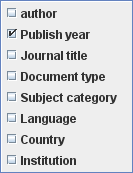
Color Code By
This option allows you to assign colors to nodes according to their record properties. That is, you can select a field to which to apply colors. This process takes the top 20 occurring data values and assigns them one of the 20 node colors (see Set Node Color). Any node that is not within the top 20 values remains black.
For example, by selecting Publish Year from the Color Code By menu, you can view, by color, records that were all published in the same year.
Color Code By Menu
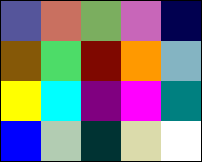
This option allows you to apply color to selected nodes on the Citation Map.
Select the check box of each needed record that appears in the Results Set panel
Select Set Node Color to display a 20-color palette.
Click a color to assign that color to the selected nodes and to close the color palette.
Set Node Color Palette
If you decide to color the nodes by Publish Year (or another option), you may get a different view - the selected Color Code By field takes precedence.
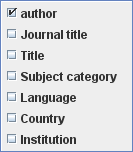
Set Node Text
This option allows you to select the field information that you wish to display in the nodes in the Citation Map.
For example, by selecting Author from the Set Node Text menu, you can view the author's name in each node.
Set Node Text Menu
The Print button opens a pop-up browser window that displays the Citation Map image. Click the Print link in the top right corner to print the image.
After you create a Citation Map, use the Year Range feature to set upper and lower year ranges. Drag and release the left and right arrows to adjust the year range. For example, you can set the year range to view records published from 1995 to 2005.
Click the Limit button to redraw the Citation Map to show only those records that fall within the selected year range. After you redraw the map, the Results Set panel will list only those records shown in the redrawn Citation Map including the target record. The Record View panel continues to show the target record.
Note that you cannot adjust the year range beyond the date of the target record.
These buttons help you quickly reconfigure your Citation Map.
![]() Expand: Allows you to expand the space around the node on which the Citation
Map is currently centered.
Expand: Allows you to expand the space around the node on which the Citation
Map is currently centered.
![]() Contract: Allows you to collapse the space around the node on which the
Citation Map is currently centered. Contracting is a good way to quickly see color
relationships.
Contract: Allows you to collapse the space around the node on which the
Citation Map is currently centered. Contracting is a good way to quickly see color
relationships.
![]() Center Root Document: Allows you to re-center the Citation Map on the original
target node.
Center Root Document: Allows you to re-center the Citation Map on the original
target node.
![]() Create New Citation Map: Allows you to create a new map exactly as you
would from the Manage menu.
Create New Citation Map: Allows you to create a new map exactly as you
would from the Manage menu.
Example - Citation Patterns by Publish Year
This example shows you the citing and cited relationships by Publish Year. It provides a visual view of changes in citation patterns over time.
-
Follow steps 1 - 3 in the section called Creating a Citation Map.
-
Select Publish Year from the Order Nodes By menu. The nodes shift positions and are now in chronological order.
-
Select Publish Year from the Color Code By menu. Records published in the same year all have the same color.
-
Select Author from the Set Node Text menu. Records display the name of the author.
-
Click the close
 control icon to close the Results Set and Record View panels so that you can have
a better view of your Citation Map.
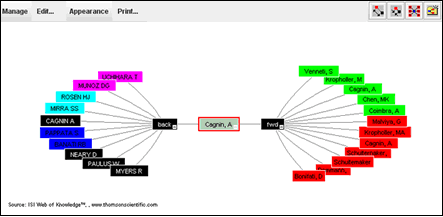
Citation Map Organized and Color Coded by Publish Year and Author
Other Reasons for Creating a Citation Map
-
To see the impact of a paper over diverse multidisciplinary subject fields, select Subject Category in steps 2, 3, and 4.
-
To see how widespread a paper has been distributed and read, select Country in steps 2, 3, and 4.
-
To see which institutions cited and were cited by the target paper, select Institution in steps 2, 3, and 4.
Information About ...
- Citation Map Panels
- Results Set and Record View Panels
- Results Set Panel
- Record View Panel
- Manage Menu
- Edit
- Appearance Menu
- Year Range
- Quick Change Buttons
- Example - Citation Patterns by Publish Year
- Other Reasons for Creating a Citation Map
System Requirements
Installing Java
To create and view Citation Maps, you must install the most current version of the Java runtime environment and the necessary browser plug-in.
To install the most recent current version of Java and the associated plug-in, click Free Java Download
About Citing and Cited Records
Keep in mind the following when analyzing citations.
-
Forward Only citations (citing articles) come from source records in Web of Science.
- Backward Only citations (cited references) come from source records and non-source cited articles.
For more information, see How We Count Citing Articles.
More About Generations
A paper's cited references and citing articles are referred to as the first generation of cited and citing papers. Each of those cited papers may have cited references of their own and each of the citing articles may have citing articles of its own. This second level of papers is referred to as the second generation.
Please be aware ... Nodes in a Backward Only, second generation Citation Map end at the first generation if they are not source records in Web of Science or if they are inaccurate variations on a source record.
Please note ... Nodes in a Forward Only, second generation Citation Map end at the first generation if those records do not have citing articles.
Printing Tips
When trying to print a Citation Map with a large number of citations (forward, backward, or both), we suggest:
-
Click the close
 control icon to hide the Results Set and Record View panels to provide more real
estate for the Citation Map.
 -
Use your left mouse key to move the nodes around to expand different views of the Citation Map.
-
Click the collapse button on the back node to print only the forward view.
-
Click the collapse button on the fwd node to print only the backward view.
